|
COMETS EARTH JUPITER KUIPER BELT MARS MERCURY METEORITES NEPTUNE OORT CLOUD PLUTO SATURN SOLAR SYSTEM SPACE SUN URANUS VENUS ORDER PRINTS
PHOTO CATEGORIES SCIENCEVIEWS AMERICAN INDIAN AMPHIBIANS BIRDS BUGS FINE ART FOSSILS THE ISLANDS HISTORICAL PHOTOS MAMMALS OTHER PARKS PLANTS RELIGIOUS REPTILES SCIENCEVIEWS PRINTS
|
Related Documents
Download Options
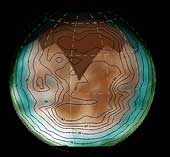
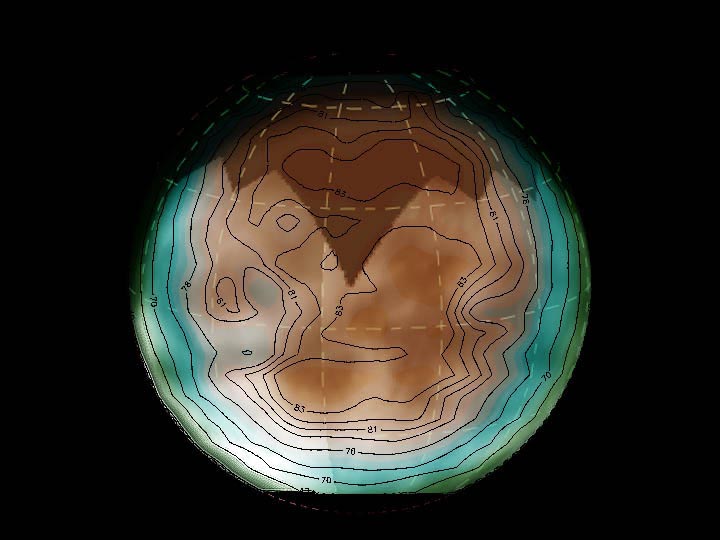
This image shows Titan data from the passive radiometer mode of Cassini's radar instrument overlaid onto a visible-light image mosaic from the spacecraft's imaging science subsystem. The contours and colors show Titan's radiation at microwave wavelengths (about two centimeters or 0.79 inch), while the light and dark shading is from the optical image. This microwave radiation comes directly from Titan itself, rather than being a reflection from the Sun as detected in visible-light images. The microwave brightness tells us about surface properties such as temperature composition and roughness. The brightness decreases when the angle of the surface is tilted from the viewer, causing the edges of Titan's disc to look dark relative to the center even though they are probably at the same temperature. Since the variations in brightness are likely larger than variations in physical temperature, they are probably due to compositional or structural properties of the surface. There is a significant correlation between areas that are bright in the microwave and dark in the optical, and vice versa. Comparison of data sets will help determine the causes of these variations. The radar data was taken on Oct. 26, 2004, during Cassini's first close encounter with Titan. The imaging science subsystem data was acquired on approach to the moon. |